How to improve operational efficiency with AI in 2025
Replace manual tasks with integrated AI workflows to boost operational efficiency.
Operational efficiency isn't just a corporate buzzword for cost-cutting; it's about systematically rewiring how your business creates value. The real goal is to hunt down and eliminate friction in your core processes, turning your company into a more resilient, self-improving machine. This is the alchemy of modern operations: transforming mundane inputs into valuable, streamlined outcomes.
To improve operational efficiency, you must replace fragmented manual tasks with intelligent, integrated AI workflows. A recent Gallup report (2023) found that disengaged employees cost the global economy $8.8 trillion, highlighting the immense price of operational friction. Unlike generic advice, this guide will show you real CodeWords workflows.
Many of the best operators feel perpetually trapped. The daily grind consumes all energy, leaving no room for strategic thinking. The problem is not effort; it is that effort is poured into low-impact, repetitive tasks.
True efficiency happens when you ditch massive overhauls for small, high-leverage AI workflows that create capacity for high-value work. With an effective API integration platform, you can turn your collection of apps into a single intelligent system that works for you.
TL;DR: How to improve operational efficiency
- Globally, disengaged employees cost the economy $8.8 trillion in lost productivity (Gallup, 2023).
- Focus on small, high-leverage AI workflows over large, disruptive overhauls.
- The goal is creating strategic capacity, not just doing the same work faster.
How do you find your biggest efficiency drains?
To improve operational efficiency, you must first become a master diagnostician. You cannot fix what you cannot see. This requires going deeper than surface-level problems to find the hidden friction points that quietly drain your team's energy and your company’s cash. The goal is to see the process, not just the people working within it.
Most people believe the biggest operational drains are the most time-consuming tasks. The opposite is often true.
The real culprits are the small, frequent, high-friction activities — the thousand tiny cuts that do the most damage over time. Think of a sales team manually qualifying leads; each one is quick, but the cumulative effect is a massive, slow-moving bottleneck.
Adopt a first-principles approach
Before you optimize anything, get back to basics. What is this process really trying to achieve? Forget how it is done today and focus entirely on the desired outcome. This mental reset is critical because many teams are efficient at doing things that should not be done at all. Start by mapping the critical path of a core function, like turning a new lead into a paying customer. A simple value stream map works well for this. Document every step, every handover, and every tool involved.
Here's the deal: the point is visibility, not perfection. You will immediately see redundancies and the exact spots where work stalls waiting for someone else.
Follow the data, not your gut
Your intuition is a useful starting point, but data is your ground truth. Our assumptions about where we lose time are almost always wrong. Use the data you already have in your CRM, project management software, and financial systems to validate your process map.
Look for key metrics that indicate friction:
- Cycle Time: How long does it take from the start of a process to the very end?
- Lead Time: How much of that cycle is spent waiting versus doing active work?
- Error Rates: Where do mistakes happen most often, forcing people to do things over?
Analyzing these numbers replaces vague feelings of inefficiency with a concrete list of problems to attack. For instance, a marketing team might find that 30% of their content creation cycle is not spent on creative work but on waiting for approvals. That's a clear, data-backed bottleneck you can fix.
Uncover the qualitative friction
Numbers only tell half the story. The other critical source of truth is your team. They live with the daily friction of broken processes, and their engagement directly reflects your company’s operational health.
Gallup’s State of the Global Workplace (2023) report found that only 23% of workers were engaged at work. Companies with highly engaged workforces outperform their peers by up to 17% in productivity and 21% in profitability. You can discover more insights about these workplace findings on Gallup.com.
Run short, informal "listening tours" with your team. Ask open-ended questions to uncover tasks that create the most frustration, not just the ones that take the most time.
Try asking questions like:
- "What is the most annoying or repetitive thing you have to do each week?"
- "If you could eliminate one part of your workflow, what would it be?"
- "Where do you find yourself waiting for information from other people or systems most often?"
These conversations will reveal the "paper cuts": small annoyances that kill morale and create subtle delays. Combining hard data with real-world insights from your team builds a complete picture of your biggest efficiency drains.
How should you prioritize what to automate first?
You have mapped out your operational bottlenecks. The challenge now is deciding where to start. Attacking the biggest or loudest problem is rarely the best move. You need a strategy to improve operational efficiency effectively.
Sharp operators use a simple prioritization matrix. This is not about complex spreadsheets; it is a way to weigh each potential automation by its payoff and its feasibility right now. It forces discipline and directs resources where they will build the most momentum.
You might think you need a massive budget for this. Here's why that's not the case: starting small with no-code AI is often the smartest play. Quick wins build trust and show value, creating a flywheel effect that helps get buy-in for bigger projects.
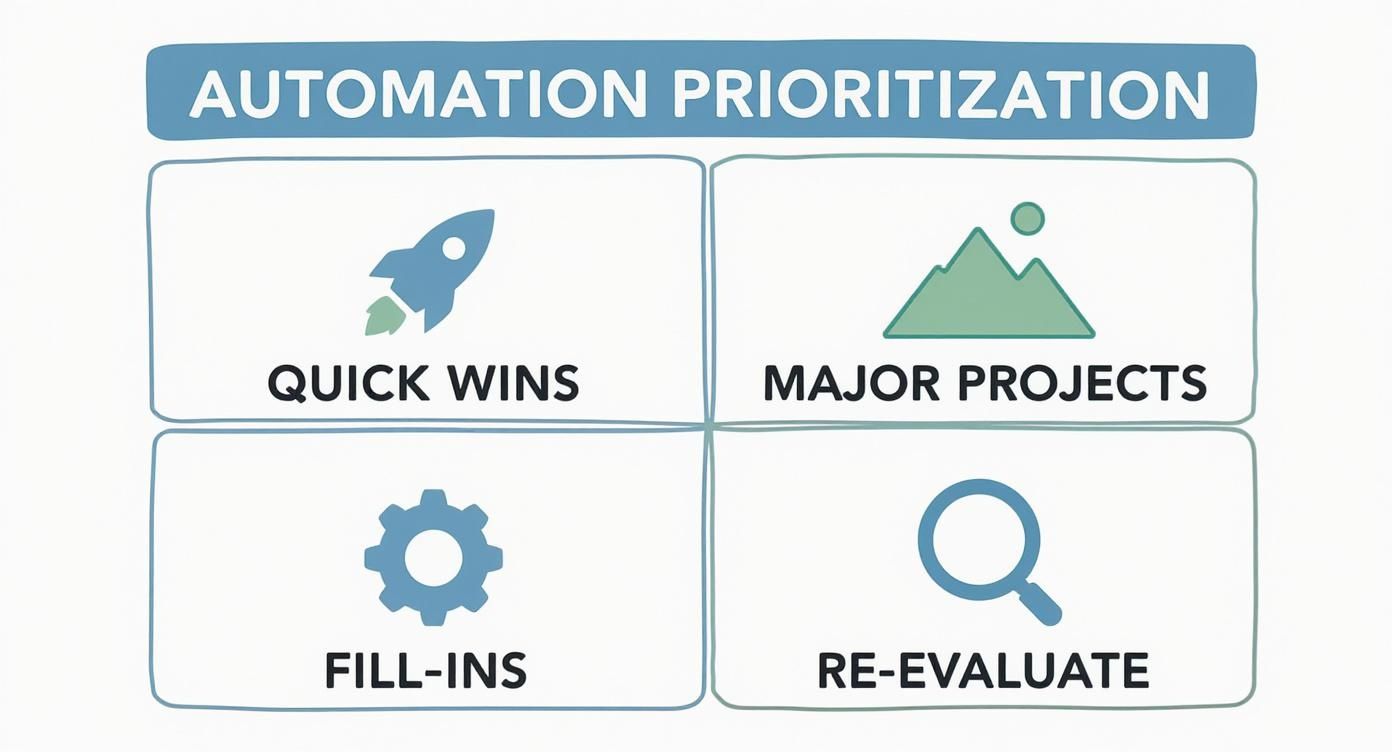
The impact vs. feasibility matrix
This framework sorts your potential automation projects into four buckets based on two questions:
- Impact: How much value will this create? Think in terms of hours saved, revenue gained, or errors reduced.
- Feasibility: How easily can we get this done with the tools and skills we have today?
Plotting your bottlenecks onto this matrix turns a messy to-do list into a strategic roadmap.
Quadrant 1: Quick wins
These are your immediate priorities: high-impact and high-feasibility. This is the low-hanging fruit that delivers a noticeable win almost immediately. A classic example is automating a weekly sales report. An AI workflow can handle this easily, freeing up your sales team to sell. Nailing these first creates positive buzz and gets the organization excited about what is possible.
Quadrant 2: Major projects
Here you find high-impact, low-feasibility initiatives. These are the big transformations that promise significant results but require serious time, resources, or technical skills. Think overhauling a legacy CRM or integrating two massive enterprise systems. Approach them carefully with proper planning and a dedicated budget. Before you dive into a huge project, check out our detailed guide on how to streamline business processes.
Quadrant 3: Fill-ins
Low-impact, high-feasibility tasks are Fill-Ins. They are easy to automate but do not move the needle much on their own. This could be auto-archiving old project files or standardizing email signatures. These are perfect for downtime or as training exercises for team members getting started with automation tools.
Quadrant 4: Re-evaluate
Finally, the low-impact, low-feasibility quadrant. These are tasks you should probably ignore for now. They are "nice-to-haves" that are a pain to implement and offer little reward. Your energy is better spent on Quick Wins and planning for Major Projects.
Automation tool comparison
For "Quick Wins," a no-code AI tool like CodeWords is often the perfect fit, delivering value almost instantly. For "Major Projects," you might need to weigh the benefits of a low-code platform against the ultimate flexibility of custom code.
CodeWords Workflow: Prioritization Analysis
Prompt: Analyze this CSV of operational tasks, which includes columns for 'Task', 'Hours Per Week', 'Impact Score (1-10)', and 'Automation Difficulty (1-10)'. Identify the top 3 'Quick Win' candidates where Impact is >7 and Difficulty is <4. Format the output as a numbered list with a brief justification for each.
Output: The AI provides a clear, prioritized list.
1. Generate Weekly Sales Report: High impact (9/10) due to 15 hours saved weekly, low difficulty (3/10).
2. Triage Support Tickets: High impact (8/10) by cutting response time, low difficulty (4/10).
3. Onboard New Hires: High impact (8/10) by improving consistency, low difficulty (4/10).
Impact: This workflow turns a subjective debate into a data-driven decision in under a minute, replacing hours of manual analysis with a clear, actionable plan.
How can you implement AI workflows across business functions?
Once priorities are set, it is time to move from theory to practice. This is where you turn frustrating bottlenecks into smooth, automated workflows that give time back to your team. The magic is not a massive system overhaul; it is applying AI to specific, high-friction tasks your team deals with every day.
This is not a niche trend. A PwC survey from 2022 found that 67% of businesses now use automation to manage their processes.
However, there’s a problem most tools ignore: they are not built for the people closest to the work. The biggest wins often come from giving operators in sales, marketing, and HR the tools to build their own solutions. The matrix makes it obvious: focus on "Quick Wins" first. These high-impact, low-effort automations build momentum.
Transforming sales follow-up
One of the biggest time-sinks in any sales organization is inconsistent follow-up. A lead’s interest has a short shelf life, but manual processes often leave hot prospects waiting. This is not a problem with your reps; it is a broken process waiting for automation. An AI workflow can instantly generate a tailored follow-up based on CRM data and call transcripts. For instance, ACME Corp. cut its lead response time by over 80% in Q1 2024 by automating this exact process.
CodeWords Workflow: Automated Lead Follow-Up
Prompt: When a deal stage in HubSpot changes to 'Meeting Booked,' get the transcript from Fireflies.ai. Summarize key pain points and next steps, then draft a personalized follow-up email to the prospect referencing these points. Send the draft to the deal owner in a Slack DM for approval.
Output: A sharp, context-aware email draft appears in the sales rep's Slack moments after their call ends. They just click "approve."
Impact: This workflow guarantees 100% consistency in follow-up, which directly fuels higher conversion rates.
Streamlining marketing reporting
Marketing teams spend too much time manually pulling data for performance reports. Sifting through Google Analytics, social media accounts, and ad platforms is tedious work that eats up hours that could be spent on strategy. You can set up an AI workflow to connect to all your data sources, pull key metrics, and assemble them into a clean report that gets delivered automatically. (For more ideas, check out these powerful business process automation examples.)
CodeWords Workflow: Weekly Social Media Performance Report
Prompt: Every Friday at 4 PM, pull follower counts, engagement rates, and top-performing posts from our LinkedIn and X accounts for the past 7 days. Compile this data into a formatted summary and post it in the #marketing-kpis Slack channel.
Output: A clean, easy-to-scan report lands in Slack automatically, giving the team instant visibility.
Impact: Frees up 3-5 hours of a marketing manager's time every week. That is time they can now spend analyzing trends and optimizing campaigns.
Modernizing employee onboarding
For HR and ops teams, onboarding is a critical process often fragmented by manual tasks. Coordinating paperwork, scheduling training, and setting up system access can create a disjointed experience for new hires. An automated workflow can orchestrate the entire thing, creating a smooth, professional experience every time.
CodeWords Workflow: New Hire Onboarding Orchestration
Prompt: When a candidate is marked 'Hired' in our ATS, create a user profile in Google Workspace. Add them to the #general Slack channel and send a welcome message with a link to the employee handbook in Notion. Create a task for their manager in Asana to schedule a 30-day check-in.
Output: A series of perfectly timed actions kicks off automatically. The new hire gets day-one access, and their manager gets a reminder for their first check-in.
Impact: Slashes administrative time spent on onboarding by over 70% and creates a better first impression, which helps with long-term employee retention.
How do you measure the ROI of improved efficiency?
Rolling out new AI workflows is only half the job. You must calculate the return on investment to close the loop, turning anecdotal wins into a solid business case for doing more. True efficiency is not just about the hours you get back. It is about the strategic capacity you unlock. That shift from reactive busywork to proactive strategy is the real prize.
Moving beyond simple time savings
The most obvious metric is time saved. A quick calculation can put a dollar value on your efforts.
(Hours Saved per Week) x (52 Weeks) x (Average Hourly Employee Cost) = Annual Hard Savings
This formula gives you a clean, defensible number. But that's not the full story. This equation ignores second-order benefits where the most significant value is often hiding. These are effects like reduced employee burnout, fewer costly errors from manual data entry, and the agility to respond to market changes faster. These are all direct results of better efficiency.
A more holistic ROI model
To get the full picture, you need a model that balances hard, quantifiable metrics with softer, qualitative gains.
Hard Metrics to Track:
- Cost Reduction: Look at lower operational expenses, reduced software license fees for redundant tools, and less need for overtime pay.
- Revenue Growth: Connect new workflows to increases in sales conversions, higher customer lifetime value, or a faster lead-to-close time.
- Error Rate Reduction: Measure the drop in mistakes in areas like order processing, invoicing, or data management. Every error has a cost.
Soft Metrics to Assess:
- Employee Morale and Retention: Use simple pulse surveys to see how the team feels. A drop in voluntary turnover is a powerful sign.
- Customer Satisfaction (CSAT/NPS): Faster response times and more consistent service will move the needle on how customers feel about you.
- Strategic Capacity: Track the number of new strategic projects your team can launch. This is where real growth comes from.
For a deeper dive, understanding specific metrics like the marketing efficiency ratio is key for accurately judging the return on your efforts in different departments.
The implication is clear. Measuring ROI is not a one-time task; it feeds a continuous cycle of improvement. Each win builds momentum, creating a powerful flywheel effect. This transforms efficiency from a series of one-off projects into a core part of your company culture. The ultimate ROI is the creation of an organization that is more agile, more resilient, and better equipped to win.
Start automating now
Frequently asked questions
Where is the best place to start with automation if I have a limited budget?
Start with a high-frequency, low-complexity task that creates recurring friction for one team. A perfect example is automatically generating a weekly sales report or triaging incoming customer support tickets. These deliver a clear, measurable win quickly.
How do I get buy-in from my team to adopt new automated workflows?
Frame automation as a tool that helps them, not one that replaces them. Kick things off with a pilot project that solves a common headache for a respected team. Once they see it saves them hours, their success story becomes your most powerful internal case study.
Can AI automation handle complex, multi-step processes?
Yes. Modern AI can orchestrate complex workflows that span multiple apps, use conditional logic, and include human-in-the-loop steps for approvals. The key is to map the entire process, break it down into smaller stages, and automate each piece individually.